11. Trading a whole year with SD
I'm new here · 5/6 I'm working on the backtester · 5/6 I want to change a trading strategy · 3/5 I want to rerun the evidence · 4/5 I run the live tools · 2/2
Chapters 5 and 8 graded single trades. This chapter asks the question a person with an account actually has: "if I had run this strategy for all of 2022, what would my account have done?" It asks it for every year from 2008 to 2026, with no look-ahead, at four account sizes.
#The rules of a full period
src/strategy/book.rs defines "trade a full month" and "trade a full year"
the same way:
- Start flat: cash only, at the close of the last trading day before the period.
- Decide at every close, from SD computed on bars up to and including that close.
- Fill at the next open (stocks) or at that close (options, priced off the close). Every fill pays costs: 5 bp a side for stocks; for options, 2–4% of the option price plus commission.
- Mark to market every day. Equity is cash plus what every open position is worth.
- End flat: close everything at the period's last close.
No look-ahead. SD's two fitted pieces, the expected-move model and the
side model, are refitted for every year on outcomes known before that
year began (model_for in sd_year). The squeeze clock, momentum and
decay have no fitted weights. The straddle's 1.3 vol-edge threshold was
chosen on 2001–2018, so 2019 onward is fully out of sample; that is the
row to trust most.
Whole contracts, real prices. Option trades are bought in whole
contracts. One contract's maximum loss uses the price actually printed that
day: the adjusted history times a split/dividend scale, sd_fetch_history --scale. A trade the account cannot afford one contract of is skipped.
That is what makes a $5,000 account different from a $1,000,000 one.
#The strategies
| Strategy | Kind | What it does |
|---|---|---|
| SPY buy & hold | benchmark | own the market |
| Equal-weight hold | benchmark | 1/N of every name, held |
| SD side | stocks, weekly | own what SD puts above 0.5 |
| SD fire long / long-short | stocks, daily | ride momentum while a fired squeeze is alive (shorts too) |
| SD big-move / calm tilt | stocks, weekly | the 20 names SD expects to move most / least |
| SD swing long | stocks, few days | fresh fires (first half of their life) with an upward lean |
| SD stretch reversion | stocks, weekly | the 10 names stretched furthest below their 21-bar average |
| CoilStraddle | options, ~1 month | straddle when coiled and SD's expected move ≥ 1.3× implied |
| WeeklyCoilStraddle | options, ~1 week | the same test, one-week straddle, quick exits |
| QuietCondor, FireVertical, SdRouter+Condor | options | from chapter 5 |
| Always… | options baselines | the same structure with no SD filter |
#Every year at a glance
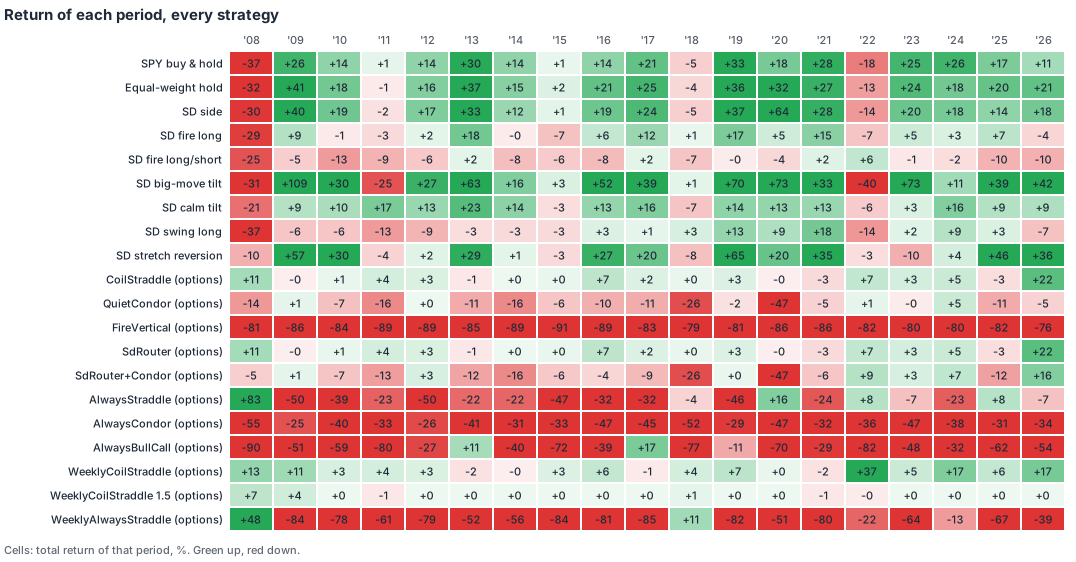
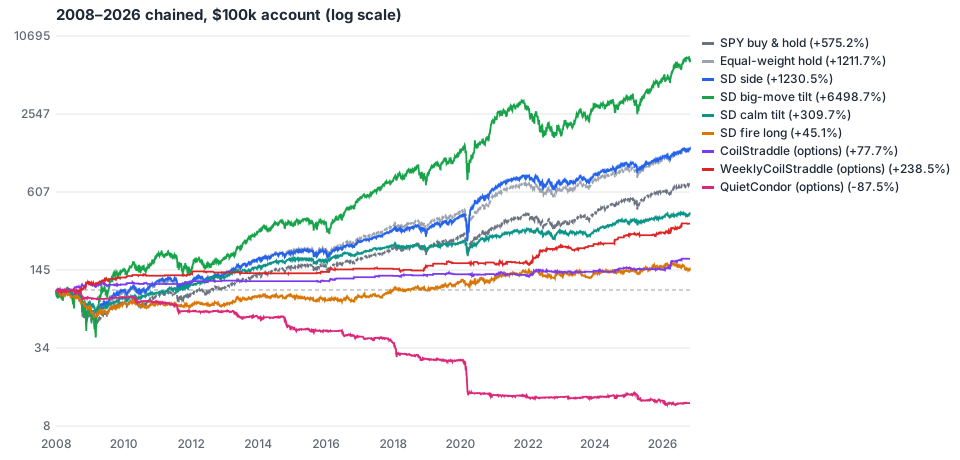
Each year's own curves are in docs/charts/:
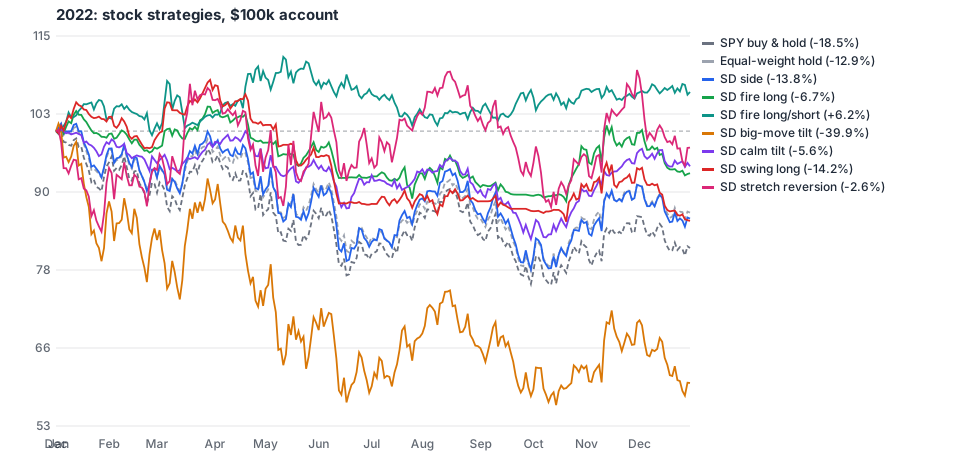
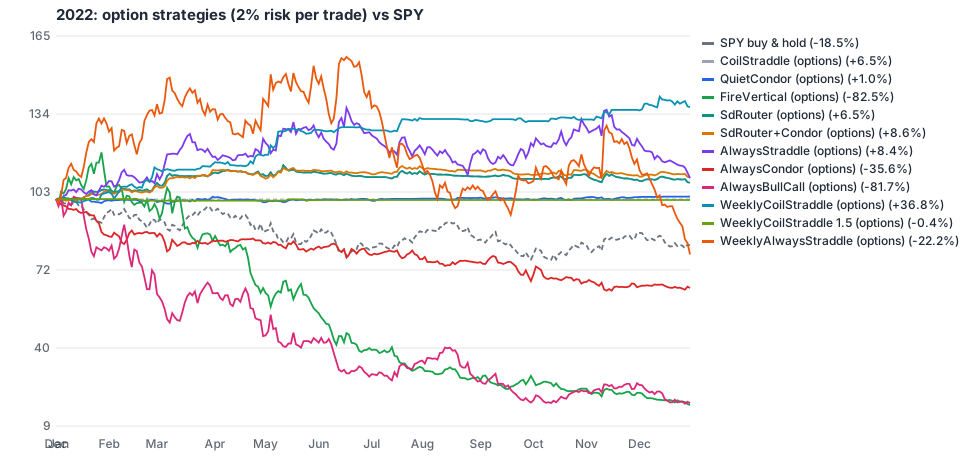
equity-<year>-stocks.svg and equity-<year>-options.svg. Here is 2022,
the hardest recent year:
And every month of 2024 as its own period (sd_year --months 2024):
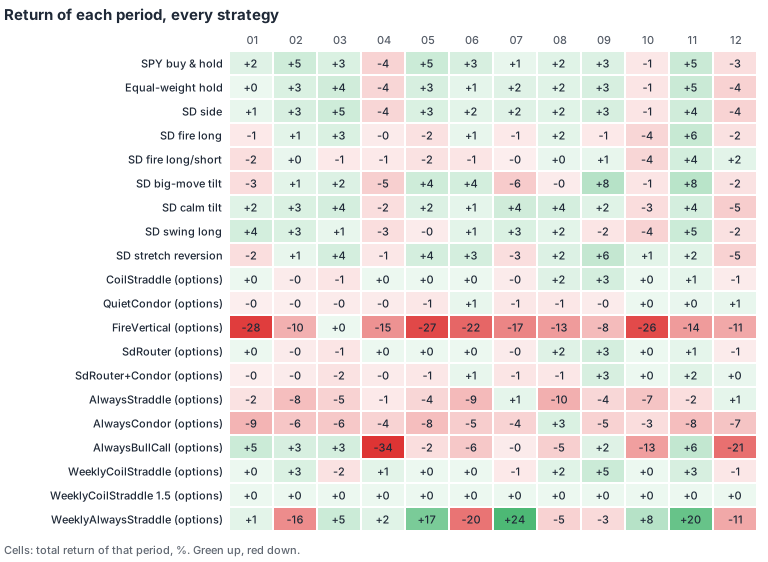
#The scorecard ($100k account, whole contracts)
Out of sample, 2019–2026 (reports/year/summary.txt; CAGR, Sharpe,
Sortino and drawdown come from the chained daily equity curve, with a
risk-free rate of 0):
| Strategy | CAGR | Sharpe | Sortino | Max DD | Up years | Win % | EV / trade | Profit factor |
|---|---|---|---|---|---|---|---|---|
| SPY buy & hold | +16.7% | 0.90 | 1.28 | 33.7% | 88% | — | — | — |
| Equal-weight hold | +20.3% | 1.08 | 1.53 | 34.2% | 88% | 69.7% | +20.7% | 4.75 |
| SD side | +21.9% | 1.04 | 1.52 | 39.2% | 88% | 61.7% | +4.1% | 2.38 |
| SD big-move tilt | +32.3% | 0.97 | 1.41 | 50.1% | 88% | 61.1% | +5.1% | 2.47 |
| SD calm tilt | +8.9% | 0.75 | 1.04 | 24.0% | 88% | 56.3% | +1.3% | 1.74 |
| SD stretch reversion | +22.4% | 0.87 | 1.27 | 49.4% | 75% | 59.8% | +0.7% | 1.41 |
| SD fire long | +4.9% | 0.45 | 0.63 | 14.4% | 75% | 46.2% | +0.1% | 1.09 |
| SD swing long | +3.6% | 0.34 | 0.49 | 24.7% | 75% | 48.7% | +0.05% | 1.05 |
| CoilStraddle | +4.1% | 0.74 | 1.50 | 8.0% | 62% | 47.5% | +10.1% | 1.56 |
| WeeklyCoilStraddle | +10.7% | 1.31 | 3.34 | 8.7% | 88% | 57.0% | +16.6% | 1.92 |
| WeeklyAlwaysStraddle (baseline) | −59.6% | −1.73 | −2.91 | 99.9% | 0% | 39.1% | −5.7% | 0.84 |
| QuietCondor | −9.9% | −0.84 | −0.98 | 57.2% | 25% | 61.4% | −3.2% | 0.59 |
| FireVertical | −87% | −4.0 | −4.8 | 100% | 0% | 34% | −17% | 0.51 |
Read it like this:
- No SD stock strategy beats equal weight risk-adjusted. SD side is equal weight in disguise, because the side is almost always up (chapter 8). The big-move tilt earns more by taking more risk (its drawdown is 50%), and the universe is 125 of today's large names, so a high-volatility tilt is flattered by survivorship.
- Direction strategies lose (fire long/short, FireVertical, swing). That is the same lesson as chapter 8, now in dollars.
- Selling premium loses (QuietCondor, every condor).
- Buying straddles only when SD says "coiled and cheap" is the one SD idea that makes money, and it turns the baseline's −60% a year into a gain. The weekly version is the strongest result in the book. Read the next section before you believe it.
#The proxy caveat (read this)
Single-stock option prices in the backtest come from a proxy: implied volatility estimated from realized volatility, fitted on five ETFs that have real Cboe volatility indices. Two things follow:
- On those five ETFs, priced with real IV, the coil-and-cheap setup almost never happens: one trade in 19 years. Real implied volatility does not fall as far as realized volatility does in a coil.
- The proxy cannot see earnings. A one-week straddle across an earnings date costs far more in real life.
So the straddle results are an upper bound until real prices confirm them. Chapter 14 shows how the live tools handle this: every live decision uses today's real option chain, and logs it, so real evidence builds up from the first day.
#Probability of success: SD's vol edge
The cleanest thing SD calculates for an option trade is its vol edge: SD's expected move ÷ the move option prices imply. Win rate rises steadily with it, for every straddle the backtest opened:
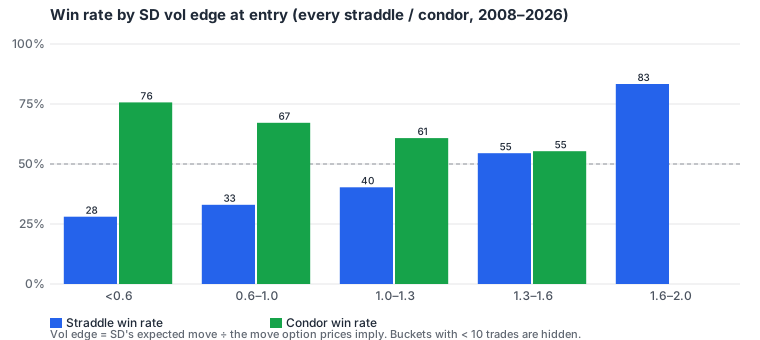
| Vol edge | Straddle win rate | Mean return on risk | Condor win rate |
|---|---|---|---|
| < 0.6 | 28% | −15% | 75% |
| 0.6–1.0 | 33% | −9% | 67% |
| 1.0–1.3 | 40% | +1% | 60% |
| 1.3–1.6 | 54% | +19% | 55% |
| 1.6–2.0 | 83% (12 trades) | +57% | 28% |
These per-bucket rates are the p_profit that trade.using.rs shows next to
each trade (from 2019 onward when a bucket has at least 30 trades).
#Account size changes the answer
The same strategies at 2% risk per trade, whole contracts, 2008–2026
(scripts/sd_year_accounts.sh):
| Account | CoilStraddle CAGR | Trades taken / skipped | WeeklyCoilStraddle CAGR | Sharpe |
|---|---|---|---|---|
| $5,000 | +0.6% | 56 / 318 | +2.0% | 0.71 |
| $25,000 | +1.5% | 186 / 188 | +4.0% | 0.85 |
| $100,000 | +3.1% | 318 / 56 | +6.7% | 1.05 |
| $1,000,000 | +3.7% | 374 / 0 | +7.3% | 1.03 |
A $5,000 account risking 2% has $100 per trade, and most straddles cost
more than that per contract. Small accounts must either risk more per trade
(SD_OPTION_RISK=0.05 and 0.10 scale both return and drawdown about
linearly; Sharpe stays the same) or stick to stock strategies.
#Short setups (intra-week, a few days)
Three few-day ideas were tested: SD swing long, SD stretch reversion and WeeklyCoilStraddle.
- Swing long (direction) has no edge.
- Stretch reversion earns the market's return with more risk.
- The weekly straddle is the best risk-adjusted strategy in the backtest, with the proxy caveat above at full strength. It is published on trade.using.rs as a few-day setup, decided at real prices.
#The strategy chosen to run live
The runner (chapter 14) trades CoilStraddle and WeeklyCoilStraddle, at real option prices. These are the only SD strategies with positive expected value per trade and positive years out of sample. They use little capital (1–3% exposure), so they belong next to a stock portfolio, not in place of one. For the stock portfolio itself the evidence says: equal weight (or Thatha's selection) and SD for timing and size, not side.